Skip to content
  and Subjective Hand-feel16")
Subjective hand-feel panels represent a critical R&D liability, as human tactile perception is strictly calibrated to a 42-130 kPa fingertip skin modulus. Traditional material characterization often overstates stiffness by 200% to 1,100% due to testing artifacts, leading to manufacturing failures where products lack the 10-15% modulus gap required for consumers to perceive a measurable improvement in softness.
This technical brief evaluates how the Emtec Tissue Softness Analyzer (TSA) uses acoustic vibrations between 200–2000 Hz to convert friction into reproducible data. We analyze the optimization of 2.8 bar embossing pressures, the application of Bubond® 2646 modifiers at 4100 fpm, and the translation of ISO 12625-4:2005 standards into data-backed marketing claims.
The Psychology of Softness: Friction, Bulk, and Stiffness
Softness perception depends on material elasticity matching fingertip compliance (42-130 kPa). Technical differentiation requires a 10-15% modulus gap to be detectable by consumers during use.
The Mechanics of Tactile Perception: Elasticity and Surface Friction
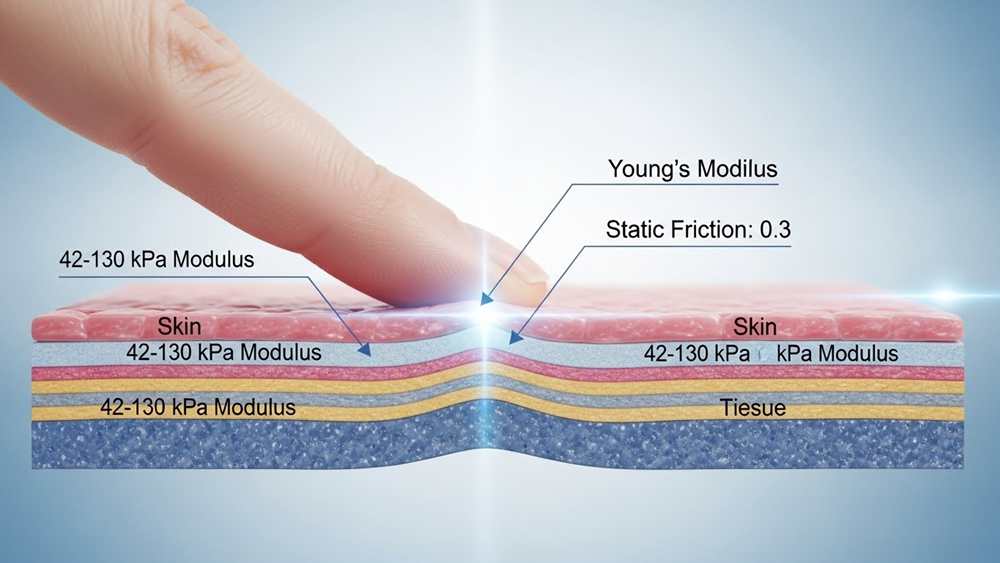
Tactile perception relies on Young’s modulus (E), which measures how a material resists deformation. Human fingertips serve as the biological benchmark for this sensation, operating within a specific mechanical range. When a material’s elasticity aligns with the skin’s own modulus, the brain registers “comfort” rather than “resistance.”
- Fingertip Skin Modulus: 42-130 kPa.
- Friction Coefficient: 0.3 (modeled for small-tip contact).
- Surface Variables: Roughness, wear debris, and boundary lubrication.
Static friction also dictates “hand-feel.” While friction usually rises with displacement on dry, smooth surfaces, it drops as surface roughness or lubrication increases. High-end product design leverages a stiff outer skin over a soft inner core to maximize conformability, creating a superior haptic response through interfacial effects.
Technical Validation: Quantifying Compliance and Structural Bulk
Standardized testing often fails by overstating material stiffness by 200% to 1,100% due to characterization artifacts. Accurate validation requires linear fitting from stress-strain curves at 0-0.1 strain. This represents only the first 10% of material deformation, which is the exact window where human touch perception occurs.
- Indentation Platen: 24 mm diameter.
- Indentation Punches: 10 mm diameter.
- Measurement Accuracy: 2-11x reduction in error using true stress/strain equations.
- Consumer Discriminability: 10-15% difference in material modulus.
Engineering for premium softness requires more than just lowering stiffness. Manufacturers must prioritize validated elasticity over apparent bulk. Because human fingertips are highly sensitive to small changes, maintaining a 10-15% modulus gap between product tiers is the only way to ensure consumers perceive a measurable difference in quality.

Intro to the TSA: How Sound Waves Measure Surface Smoothness
The TSA quantifies surface smoothness by measuring acoustic vibrations from a rotating rotor, replacing subjective hand-feel with objective data for roughness and softness.
| Parameter | Specification |
|---|---|
| Rotor Speed | 10 cm/sec |
| Measurement Load (Initial) | 100 mN |
| Deformation Load (Max) | 600 mN |
| Frequency Spectrum (TS750) | 200–2000 Hz |
| Sample Size | 112 mm |
| Device Dimensions | 40.3 x 18.0 x 35.5 cm |
The Acoustic Vibration Mechanism: Converting Friction into Sound
Subjective hand-feel testing is a liability in R&D due to human bias and lack of repeatability. The Tactile Sensation Analyzer (TSA) eliminates this by treating material friction as a sound signal. A rotor equipped with blades spins against the sample, inducing vibrations that a high-sensitivity microphone captures and analyzes.
- Macro-roughness (TS750): The system records surface variations as acoustic peaks between 200–2000 Hz; louder sound signals indicate a rougher surface topography.
- Micro-softness (TS7): This peak identifies fiber stiffness. Lower sound intensity correlates directly to a softer material feel.
- Signal Isolation: Lab technicians often place a plastic film under tissue or paper samples to block internal porosity from interfering with surface roughness data.
- Rotor Speed: The blades maintain a constant speed of 10 cm/sec to ensure data consistency across different batches.
Technical Parameters: Load Forces and the Two-Step Measurement Process
The analyzer operates in two distinct phases to separate surface acoustics from physical structural integrity. This ensures that a material’s “bulk” properties don’t mask its surface performance. R&D teams use this data to calculate hand-feel (HF) scores and optimize chemical softener or lotion dosing.
- Phase 1 (Acoustics): The device applies an initial 100 mN load force. This light contact allows the rotor to spin and capture the vibration spectrum for roughness and softness.
- Phase 2 (Deformation): The load escalates to 600 mN to measure physical deformation. This phase identifies in-plane stiffness, elasticity (E), and plasticity (P).
- Material Recovery: The TSA tracks hysteresis (H) to evaluate how a sample recovers after compression, a critical metric for assessing the “spring” and bulk of paper products.
- Standardization: The 15 kg unit processes 112 mm samples, providing a portable but industrial-grade solution for textile and nonwoven quality control.
The “Hand-feel” Panel: Combining Lab Data with Human Perception
Hand-feel panels bridge lab data and human perception by modeling neural responses and skin temperature to predict softness with engineering precision.
| Variable | Metric / Value | Tactile Impact |
|---|---|---|
| Skin Temperature | 10°C to 43°C | Heightens perceived roughness and acuity |
| Fingertip Modulus | 42 – 130 kPa | Benchmarks material compliance |
| Neural Prediction | 12 Props / 14 Attributes | Correlates lab data to sensory feel |
| Friction Coefficient | 0.3 (Standardized) | Influences haptic slipperiness |
The Biological Interface: Mechanoreceptors and Sensory Perception
Human skin processes complex data through specialized sensors. Pacinian corpuscles detect sustained pressure and lateral stretching. When skin temperature climbs from 10 °C to 43 °C, sensory spatial acuity increases. This change makes surface roughness feel more pronounced.
Data shows that “hardness” and “coldness” dominate a person’s perception more than roughness does. Also, psychological traits like the “need-for-touch” or temporary emotional states like fear can dampen or heighten how a panelist interprets fabric compliance.
Quantifying Subjectivity: Neural Networks and Cross-Modal Correlation
Engineers now use neural networks to bridge the gap between machines and humans. These models correlate 12 physical material properties with 14 sensory attributes. This process turns a subjective “feel” into a reproducible data set for manufacturing.
- Modulus Accuracy: Validated testing uses 42-130 kPa to match human fingertip skin, correcting older studies that overshot compliance by 11x.
- Deformation Limits: Young’s modulus is measured at 0-10% strain to ensure the linear fit matches real-world compression.
- Cross-Modal Effects: High color luminance is scientifically linked to higher perceived smoothness and elasticity.
- Textural Priority: Slipperiness, coolness, and surface smoothness are the primary metrics used to validate Tissue Softness Analyzer (TSA) scores.
Friction also plays a critical role. While static friction rises with displacement on dry surfaces, it drops significantly when roughness or lubricants are introduced. Using piezoelectric force measurement allows labs to predict these shifts before the product ever hits a consumer’s hand.
Scale Your Brand with Expert OEM Toilet Paper Manufacturing
Impact of Embossing on Perceived Softness (The “Air Pocket” Effect)
Embossing creates “air pockets” and increases porosity to 16%, simulating softness through bulk recovery despite mechanical fiber densification. Use 2.8 bar to balance strength and hand-feel.
Embossing is a mechanical contradiction. While the process compresses paper fibers and increases density, the resulting pattern engraving actually increases the overall sheet thickness. This “loft” effect relies on creating physical space within the web to trick human touch into perceiving a cushioned surface.
The Mechanics of Loft: How Engraving Patterns Mimic Softness
Manufacturers distinguish between sheet densification, which reduces individual fiber thickness, and pattern engraving, which expands the total product volume. When embossing pressures reach or exceed 2.8 bar, fiber bonds break. This allows the material to expand and recover bulk once the pressure is released, particularly in non-virgin fiber samples.
The “cushioned” feel comes from apparent porosity. Higher porosity levels trap air within the structure, aligning with the compliance of human fingertip skin, which typically maintains a modulus between 42-130 kPa. Measured data shows how specific patterns and pressures change these physical attributes:
- Apparent Porosity: Ranges between 14.88% and 16.14% to maximize air trapping.
- Deco Pattern Thickness: Reaches approximately 0.252 mm at 3.2 bar pressure.
- Deco Pattern Bulk: Maintains roughly 0.010 mm³/mg for perceived loft.
- Rubber Plate Hardness: 60.3 Shore A to ensure consistent pattern depth.
Data-Driven Optimization: Balancing 2.8 Bar Pressure with TSA Metrics
2.8 bar serves as the technical tipping point for toilet tissue. At this pressure, you maximize the “air pocket” effect without causing a catastrophic loss in tensile strength. Exceeding this limit often leads to excessive fiber damage that degrades the Hand-feel (HF) score faster than the gains in bulk can compensate for.
Engineers use the EMTEC Tissue Softness Analyzer (TSA) to quantify these sensory changes. By applying TP II and QA I algorithms, labs can predict how different embossing dies will affect the final user experience. FEA modeling in ABAQUS 6.14 shows that micro-dies demonstrate limited plasticity changes between 2.4 and 3.2 bar, suggesting that the “softness” decline is driven more by surface friction and fiber stiffness than by bulk structural failure.
Verification of these trade-offs requires adherence to specific global standards to ensure consistency across production runs:
- ISO 12625-3:2014: Used for primary thickness and bulk verification.
- ISO 12625-4:2005: Used to monitor the mandatory trade-off in tensile strength.
- Young’s Modulus: Measured at 0-0.1 strain to align with haptic perception data.
Chemical Softeners vs. Mechanical Softening (Creping)
Mechanical creping physically de-densifies fiber bonds for bulk, while Yankee-applied chemicals provide surface lubrication. Combined, they deliver 11% bulk gains and 5% higher stretch at 4100 fpm.
Mechanical Creping: Structural De-densification and Blade Geometry
Mechanical softening depends on the creping blade to physically disrupt fiber-to-fiber bonds. This process creates the “bulk” and internal structure necessary for a soft hand-feel. Without this physical de-densification, the sheet remains a flat, dense ribbon of fiber.
- Crepe Ratios: Settings of 1.27 (27%) and 1.30 (30%) define the frequency and depth of the folds.
- Post-Crepe Moisture: Operators maintain levels at 2.0% to prevent structural collapse and ensure stable hand-feel.
- Machine Speed: High-speed runs at 4100 feet per minute require precise blade geometry to maintain surface consistency under tension.
Chemical Application: Yankee Adhesives and Modifier Performance
Chemical softening involves applying agents directly to the Yankee dryer surface via spray booms. These chemicals, such as Bubond® 2646, manage the adhesion between the web and the dryer. This lubrication allows the blade to create a finer crepe pattern while increasing sheet stretch.
- Adhesive Dosage: Bubond® 2646 applied at 2.2–2.5 mg/m² manages web-to-dryer pickup.
- Softening Modifiers: Applied at 8–12 mg/m² to enable a 5% increase in sheet stretch.
- Chemical Load: The spray boom delivers 7.8 pounds of dry chemical per metric ton of fiber.
- Transfer Force: A 200 psi press roll transfers chemicals to the web at 626°F hood temperatures.
The goal is to match the tissue’s physical profile to human haptic perception. Fingertip skin has a modulus between 42 and 130 kPa. By balancing mechanical bond destruction with chemical lubrication (targeting a friction coefficient near 0.3), manufacturers produce a sheet that conforms to the skin without feeling abrasive or “papery.”
Marketing Softness: Turning Lab Scores into Sales Copy
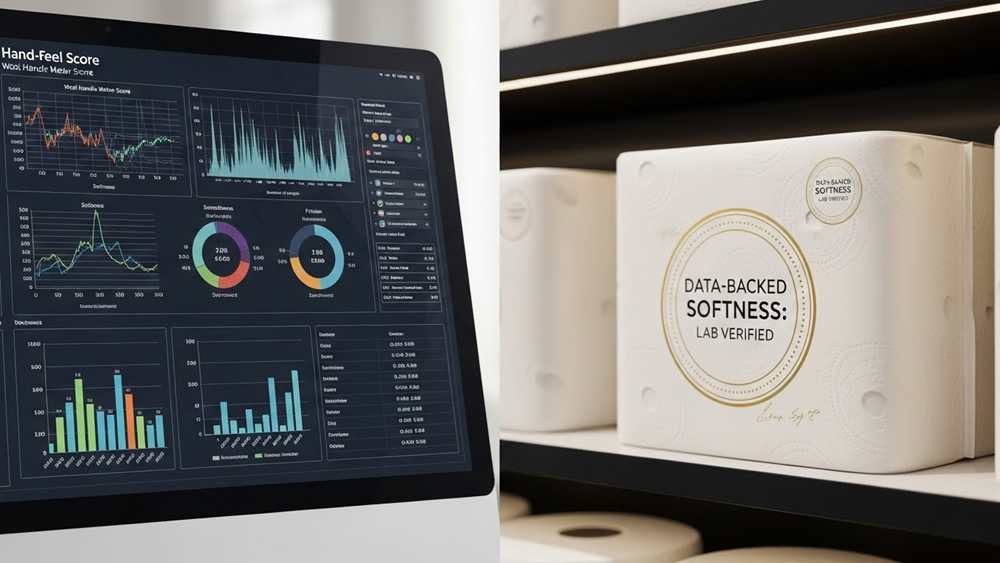
Manufacturers convert objective Wool Handle and Comfort Meter scores into “luxuriously soft” or “irritation-free” claims, replacing subjective hand-feel with global, data-backed standards to ensure brand consistency.
The Science of Claims: Mapping Lab Metrics to Consumer Benefits
Vague descriptions like “super soft” lose power when supply chains span continents. Industry leaders now bridge the gap between the lab and the showroom by translating instrument outputs into specific consumer guarantees. This process replaces inconsistent “hand-feel” panels with repeatable numbers.
- Wool Comfort Meter: Lab technicians measure 30 cm square samples to quantify protruding fibers. Lower values directly support “skin-intimacy” and “irritation-free” marketing language.
- Wool Handle Meter: This system uses a 1–10 scale to assess smoothness and friction. Scores of 8–10 allow brands to market products as “high-quality luxury” or “superior smoothness.
- Texture Analyser: Force-distance profiles measure resistance during compression. This data correlates to consumer perceptions of “pillowy softness” in products like facial tissues and toilet paper.
Standardization and Compliance: Building Trust with Technical Data
Technical data provides a legal and competitive shield. Brands use standardized benchmarks to prove their quality isn’t just an opinion, especially when competing in the North American and European markets where consumers demand proof for premium pricing.
- ASTM D2130-22: Labs test fiber diameter by microprojection to support durability claims that must exist alongside softness.
- Environmental Controls: Tests must account for humidity and temperature, as moisture significantly alters material modulus. Softness targets are adjusted to ensure claims hold true across diverse geographic regions.
- Standardized Samples: Using 100 cm square samples for friction and roughness testing provides a quantifiable benchmark against competitor products.
- Global Certifications: ISO 9001 and FDA standards validate secondary promises like “sustainable softness” and “safety-compliant hygiene,” turning raw data into trust.
By aligning material elasticity—specifically the Young’s modulus of 42-130 kPa found in human fingertip skin—with product performance, engineers can design textiles that feel intuitively “right” to the consumer. This alignment ensures that the marketing copy isn’t just creative writing; it is a technical reality.
Final Thoughts
Subjective hand-feel is a liability that causes batch inconsistency. Real profit lies in the 10-15% modulus gap—the only range where consumers actually perceive a measurable jump in luxury quality.
Replace human panels with TSA acoustic data immediately. Set embossing at 2.8 bar and chemical modifiers at 8–12 mg/m² to hit the biological ‘comfort’ target of 42-130 kPa.
Frequently Asked Questions
How do factories measure toilet paper softness scientifically?
Factories use the Tissue Softness Analyzer (TSA) to calculate a hand-feel (HF) index based on fiber softness (TS7), texture (TS750), and stiffness (D). This instrumental data accounts for grammage and ply count, showing a high linear correlation (R² = 0.8559) with results from human panel tests.
What is a Tissue Softness Analyzer (TSA) and how does it work?
The TSA is a specialized device that assesses haptic properties using sound analysis and deformation testing. It uses eight rotating paddles to evaluate surface smoothness and applies a load range of 100-600 mN to measure in-plane stiffness, correlating nearly 100% with human perception when paired with optimized algorithms.
Can a 2-ply paper feel softer than a 3-ply paper?
Yes. A 2-ply sheet can feel softer than a 3-ply if it utilizes high-quality hardwood fibers like eucalyptus, advanced Through-Air Drying (TAD) technology, or a higher caliper. A 125 μm caliper at 28 g/m² basis weight often provides a superior tactile experience compared to the basic cushioning of an extra ply.
What are the best chemical-free ways to increase softness?
Mechanical creping is the primary chemical-free method for increasing softness. While some manufacturers use plant-derived additives, the industry currently lacks standardized numeric benchmarks, such as ASTM D5237 efficacy ranges, to quantify softness improvements from chemical-free treatments.
How does the creping process affect the texture of the paper?
The creping process uses a Yankee dryer and a blade to create micro-folds in the tissue, which reduces density and increases bulk by 200% to 350%. This mechanical action triggers fiber delamination and internal slippage, significantly improving both the stretch and the perceived bulk softness of the paper.
How do brands translate technical softness scores for B2C marketing?
There is no industry-standard method for translating TSA scores into consumer marketing claims. These technical values are essential for OEM/ODM quality control and R&D, but B2C marketing focuses on qualitative benefits and conversion metrics rather than raw haptic data points.