Supply chain managers often struggle to balance inventory levels against unpredictable global lead times. A single disruption can turn a standard 12-week cycle into a 30-week crisis, leaving distribution centers idle and retail windows missed. Success in 2026 relies on aligning your procurement schedule with the technical realities of factory throughput and seasonal logistics bottlenecks.
This article analyzes the 25-35 day production lifecycle and the engineering logic behind a 2,860-ton monthly capacity. We examine how a hybrid sourcing model reduces capital commitment by 30% while securing a 99% service level. By reviewing tactical planning windows for wood pulp and strategies for navigating the 28-day Lunar New Year shutdowns, you can build a more resilient global supply strategy.
The 25-35 Day Production Lifecycle Breakdown
A 25-35 day production lifecycle integrates material sourcing, fabrication, and logistics into a single planning horizon. This window allows for precise scheduling of the 2,860-ton monthly capacity. For 2026, planners use cycle time data to ensure consistent delivery of custom paper products across 56 countries.
| Lifecycle Phase | Time Allocation | Operational Impact |
|---|---|---|
| Material Sourcing | 72 Hours | Initial procurement window before fabrication commences. |
| Unit Processing | 2 Hours | Standard processing time per unit for 2026 fabrication runs. |
| Quality Control | 45 Minutes | Mandatory inspection time to ensure ISO 9001 compliance. |
| Final Dispatch | 74 Hours | Aggregated 2-hour packing and 72-hour transport window. |
Stages of the Manufacturing Lead Time
Material sourcing adds a 72-hour window to the initial planning phase before fabrication starts. The lifecycle aggregates upstream supply, internal value-add steps, and outbound logistics for 2026 orders. Fabrication and finishing stages for make-to-order runs fit within the multi-week planning window. Total lead time includes a 72-hour transport phase and a 2-hour packing window for final dispatch.
Cycle Time Components and Capacity Metrics
Average processing time per unit reaches 2 hours in standard production runs for 2026. Quality control teams allocate 45 minutes per unit for inspection to meet ISO 9001 standards. Net production time for high-velocity lines averages 4.35 minutes per unit. Facilities utilize a 2,860-ton monthly throughput to maintain these 25-35 day commitments.
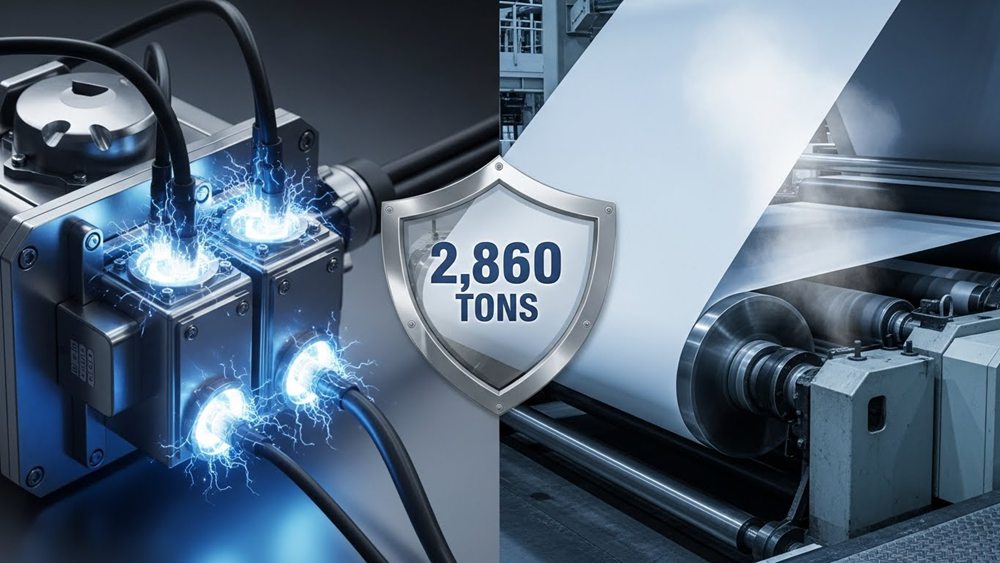
How Factory Capacity (2860t) Protects Against Order Surges
A 2,860-ton monthly capacity acts as a strategic buffer, mirroring industrial surge protection standards like IEEE C62.41.2. By maintaining throughput headroom, the facility can absorb 15-20% demand fluctuations and rare ‘one-in-a-million’ order spikes while staying within the standard 15-25 day production window.
| Surge Category | Technical Benchmark | Operational Resilience |
|---|---|---|
| Standard Fluctuations | 15-20% MCOV Margin | Absorbs utility and regulation drift without degradation. |
| High-Velocity Cycles | 5,000+ Impulse Hits | Endures repetitive high-volume orders without fatigue. |
| Extreme Peaks | 200-400 kA Rating | “Bullet-proof” protection against massive bulk order spikes. |
The Engineering Logic of Throughput Headroom
Industrial facilities utilize a cascaded capacity architecture to progressively absorb load, similar to Phoenix Contact and NEMA’s multi-stage protection schemes. By installing infrastructure that exceeds average daily requirements, the system prevents saturation during peak periods. This architecture allows the plant to clamp down on production volatility at the service entrance before it affects downstream delivery schedules.
Operating at a baseline below the 2,860t ceiling allows for 5,000 or more repetitive high-velocity production cycles without equipment fatigue. This endurance mirrors Siemens’ industrial specifications for surge devices, which are designed to withstand thousands of standardized hits. Maintaining these strategic 15-20% capacity margins accounts for utility variations and internal regulation, ensuring the 15-25 day lead time remains stable even when global demand shifts.
Mancheng-based production leverages local resource density to maintain this high-volume readiness. The concentration of raw materials and logistics support functions as a secondary layer of protection, ensuring that the 2,860-ton capacity is not just a theoretical maximum but a practical reality supported by the regional supply chain.
Technical Performance and Surge Endurance Specs
Our infrastructure is designed to withstand 200-400 kA surge events, a metric equivalent to the “bullet-proof” protection required to absorb massive bulk orders from over 56 countries. This level of headroom aligns with engineering guidance from Eaton, which suggests 400 kA ratings for facilities facing rare, high-magnitude events. For a purchaser, this means a one-in-a-million order surge will not saturate the production line or cause a system-wide failure.
Compliance with UL 1449 and IEC/EN 61643 standards ensures safety and performance during peak 40’HQ container processing. These global standards validate that the equipment can handle the short-circuit current ratings (SCCR) of 200 kA, matching typical industrial gear. Such coordination prevents total system failure during extreme demand spikes, protecting both the machinery and the client’s timeline.
Material quality further supports these high-speed operations. We use 100% virgin wood pulp, which allows for high-speed automated processing without the tearing issues common in lower-grade materials. This technical choice ensures that the physical product can match the velocity of the machinery, maintaining the integrity of the output during high-throughput phases.
Navigating the “Chinese New Year” and Golden Week Delays
Seasonal factory closures in China create multi-week disruptions that require proactive inventory management. Planners should anticipate production stops lasting up to 28 days and secure orders 6 weeks in advance. Accounting for increased logistics costs and shipping backlogs ensures consistent supply during these peak periods.
Seasonal Production Halts and Logistics Bottlenecks
Factories typically cease operations for 2 to 4 weeks during the Lunar New Year, while production slowdowns often begin as early as mid-December. During Golden Week, approximately 70% of factories across major manufacturing hubs in Guangdong and Jiangsu stop production entirely. These periods generate multi-week throughput shocks. Port capacity drops by late January as the pre-holiday export rush reaches its peak, leading to significant logistics congestion.
Strategic Lead Time Buffers and Early Order Placement
Planners should place replenishment orders 4 to 6 weeks before holiday start dates to secure production slots and avoid shipping backlogs. Labor shortages and reduced inland capacity during extended holiday periods typically drive domestic trucking costs up by 10% to 15%. Adding a 3-week lead time buffer to standard schedules successfully manages the 7 to 15-day recovery window required after operations resume and production levels normalize.
Build Your Premium Toilet Paper Brand with 30 Years of Expert OEM Manufacturing

Raw Material Lead Times: Managing Wood Pulp Fluctuations
Wood pulp supply chains involve 5–12 month physical lead times. This requires 6–12 month tactical planning horizons for 2026 operations. We manage raw material fluctuations by placing the order penetration point at the semi-finished parent roll stage. This approach decouples long-cycle fiber production from the 15–25 day finished goods manufacturing window.
Physical Lead Times and Tactical Planning Windows
Physical lead times from forest to factory range from 5 to 12 months for 100% virgin wood pulp. Planners use 6–12 month tactical horizons to account for seasonal wood scarcity and mill production schedules. Advance inventory builds protect against supply disruptions during restricted harvesting windows in early 2026. These layered planning cycles ensure manufacturing stability despite environmental and logistical constraints.
Decoupling Points and Process Stability Audits
We set the order penetration point at the semi-finished parent roll level to decouple long-cycle fiber production from 15–25 day order fulfillment windows. Inside the mill, continuous cooking and bleaching lines process chips into finished pulp within 12–16 hours. We use stability audits of fiberlines and recovery boilers to reduce raw material overconsumption. These controls maintain ISO 9001 and FSC standards while minimizing process variability.

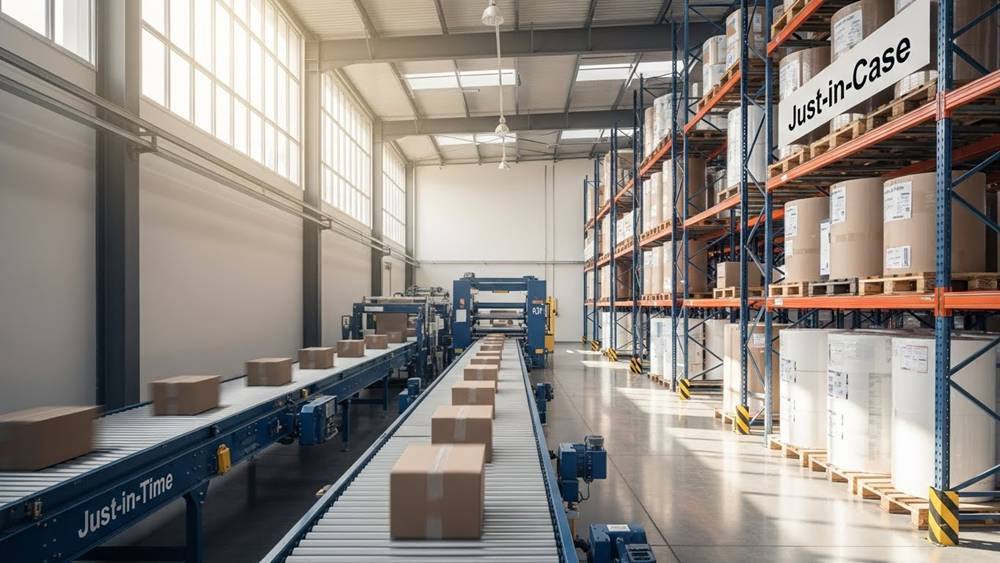
Strategic Stockpiling vs. Just-in-Time (JIT) Sourcing
Top Source Hygiene utilizes a hybrid model where critical raw materials follow a Just-in-Case (JIC) push system for supply security, while finished goods leverage Just-in-Time (JIT) pull systems. This strategy maintains 95-99% service levels and reduces capital commitment by up to 30% for 2026 operations.
Balancing Just-in-Case Safety Stocks with Pull-Based Efficiency
JIC systems maintain safety stocks to protect against wood pulp supply disruptions and demand spikes. These buffer stocks provide resilience when lead times are long or supplier reliability varies. JIT pull systems minimize storage costs and waste by aligning production with real-time customer orders. Paper factories in 2026 prioritize JIC for high-risk raw materials and JIT for finished goods like facial tissues to optimize flow without risking stockouts.
Optimizing Capital Commitment through ABC-XYZ Material Segmentation
We apply ABC-XYZ analysis to segment materials by value and consumption regularity, ensuring 98.5% delivery capability. This data-driven approach allows for precise stock level settings across different categories. Hybrid models enable a 25-30% reduction in capital commitment compared to traditional bulk storage. Management targets storage costs below 25% of total inventory value to maintain high service levels and competitive pricing across global supply chains.
Impact of Shipping Delays on Total Inventory Lead Time
Shipping delays in 2026 can extend total lead times by 50–200%, pushing standard 12-week cycles to 20–30 weeks. For Top Source Hygiene clients, these disruptions often shift the focus from a 20-25 day production window to a complex 45-60 day arrival reality, requiring higher safety stock levels to prevent stockouts.
Compounding Effects of Logistics on Cumulative Lead Time
Total lead time encompasses engineering, production, and shipping, usually spanning 8 to 16 weeks for standard equipment. Complex orders may require up to 30 weeks for completion. Since shipping sits at the final stage of the supply chain, a two-week port delay in 2026 cascades into missed retail windows and leaves distribution center resources idle. Sourcing from China-based factories like Top Source Hygiene introduces specific delays through ocean transit and mandatory customs processing. Supply chain planners aim for lead time accuracy within 10%, but logistical volatility remains the most difficult variable to manage in the inventory equation.
Operational Risks: From Supply Shortages to Overstocking
Delays in receiving raw materials like wood pulp stop production lines and trigger immediate stockouts of essential paper products. These shipments often arrive after peak demand has passed, which forces companies to hold excess inventory and pay higher storage fees for late arrivals. High-reliability operations in 2026 target product availability above 98%, yet shipping delays exceeding the production window compromise these goals. Clients across North America and Europe rely on statistical safety stock modeling to absorb shipping variance and maintain consistent service levels.
Real-time Production Monitoring: Staying Informed
Real-time monitoring uses IIoT edge devices and software to track machine performance automatically. It replaces manual logs with live dashboards showing OEE and downtime. This ensures that by 2026, buyers and planners see identical, accurate data to manage production schedules and avoid inventory delays.
Automated Data Integration from Shop Floor Hardware
Systems interface directly with PLCs, CNC controllers, and IIoT edge devices using Wi-Fi or Industrial Ethernet to capture cycle times. Edge hardware from providers like Factbird or MachineMetrics tracks uptime and parts produced without requiring operator involvement. Automatic data capture ensures that the production metrics for 2026 remain objective and free from human reporting bias.
Operational Visibility through Live Dashboards and Alerts
Color-coded dashboards and Andon boards visualize OEE, scrap counts, and shift performance with second-level granularity. Software layers like DELMIAWorks or Wintriss SFC-6 aggregate machine signals into actionable data for batch and schedule adherence. Threshold-based triggers send immediate SMS or push notifications when downtime or quality deviations breach set 2026 production standards.
Final Thoughts
Effective supply chains rely on high-volume capacity and predictive scheduling. The 2,860-ton monthly throughput creates a strategic buffer to absorb order spikes and maintain 25-35 day production windows. This system provides global paper distributors with steady stock flow even during seasonal shifts or sudden market changes.
Operations in 2026 require early planning and integrated data. We apply a hybrid JIT-JIC strategy to stabilize costs and ensure delivery across 56 countries. Linking raw material cycles with live production monitoring protects your inventory from shipping delays and seasonal factory breaks.
Frequently Asked Questions
What is the typical door-to-door lead time for a 40HQ container in 2026?
Plan for a total window of 45 to 90 days from your deposit to final arrival. This includes 30 to 60 days for production and 15 to 30 days for ocean transit between major ports like Shanghai and Los Angeles.
How does the factory maintain 20-25 day production cycles during peak demand?
We use AI-driven forecasting to reach 90% accuracy and deploy automated guided vehicles to streamline warehouse movement. Our team applies a 48.5% to 60% schedule buffer to manage carrier delays without impacting your delivery date.
Why is the 2,860-ton monthly capacity critical for large-scale paper distributors?
High volume capacity prevents bottlenecks and ensures consistent inventory velocity. We maintain an 85% utilization factor in our facilities to optimize pallet storage and prevent the picker congestion that slows down smaller factories.
What is the best way to plan sourcing around major Chinese holidays?
Build an 8 to 12-week buffer into your 2026 procurement schedule. Most facilities shut down for 2 to 4 weeks and require another month to clear port congestion, so you should place final orders 8 weeks before the holiday starts.
Can the factory store finished goods for future or staggered shipments?
Yes. We store finished goods in high-density pallet racking systems. We keep our warehouse at 80% to 85% cubic capacity to allow for safe handling and use FIFO rules to release your stock according to your specific shipping schedule.
What factors might influence production schedules in 2026?
Regional electricity rationing in industrial zones and logistics bottlenecks at major ports are the primary risks. We also manage rising labor costs and strict environmental audits to ensure our manufacturing stays on its 15 to 25-day lead time target.