Skip to content
For many B2B procurement professionals, manufacturing in China has long felt like a “black box” where critical variables remain hidden until a failure occurs at the loading dock. This lack of production transparency & monitoring often leads to expensive delays and quality regressions that erode profit margins and damage brand reputation. In today’s high-velocity market, waiting for a physical sample or a static monthly report is no longer a viable strategy for maintaining a competitive, remote supply chain.
This article outlines a technical roadmap for remote oversight, from implementing Statistical Process Control (SPC) to utilizing live stream audits and cloud-based ERP integrations. We will examine how digital QA systems achieve a 90% faster closure of deviations and how monitoring machine logs can ensure technical slitting precision within ±0.15mm. By leveraging these real-time data tools, you can replace reactive troubleshooting with proactive optimization to secure your production from thousands of miles away.
The End of the “Black Box” Manufacturing Era
Manufacturing transparency is achieved by replacing opaque ‘black box’ processes with IoT-enabled monitoring and Statistical Process Control (SPC). By capturing real-time data on machine vibration, speed, and output, manufacturers can reduce labeling errors by up to 40% and ensure strict adherence to global regulatory standards.
Defining the Shift to Real-Time Production Monitoring
The transition from reactive management to proactive optimization is driven by the integration of IoT sensors across the production floor. By capturing real-time data from machinery, operators gain visibility into critical metrics such as machine uptime, downtime, and cycle times. This shift eliminates the “black box” nature of traditional manufacturing, where variables were often hidden until a failure occurred, allowing for more precise target output rates and resource allocation.
Advanced monitoring systems track environmental and mechanical parameters, including temperature, speed, and vibration. This granular data is funneled into centralized dashboards to monitor Key Performance Indicators (KPIs) like machine utilization and energy consumption. By analyzing these variables, manufacturers can detect subtle inefficiencies and predict maintenance needs before they escalate into costly production stoppages.
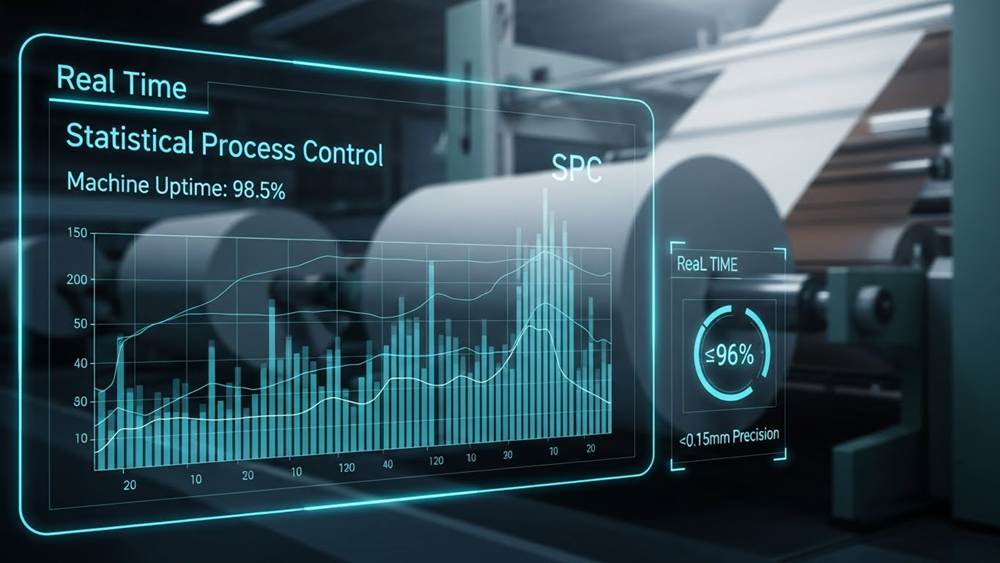
Implementing Statistical Process Control and Traceability Standards
Statistical Process Control (SPC) serves as the technical backbone for quality assurance in high-volume environments. By plotting product dimensions and weights on control charts, manufacturers can distinguish between normal variance and systemic issues requiring intervention. This is often augmented by automated vision systems that utilize specialized algorithms for high-speed defect detection, ensuring that every unit meets strict dimensional requirements.
Traceability has become a regulatory mandate, particularly under frameworks like the EU Falsified Medicines Directive (EU FMD) and the US Drug Supply Chain Security Act (DSCSA). Implementing centralized traceability systems has demonstrated significant operational benefits, including a 40% reduction in labeling errors within large-scale facilities. These systems ensure end-to-end visibility, linking raw data to finished products to maintain safety and compliance throughout the global supply chain.
Setting Up Weekly Video Production Reports
Weekly video production reports bridge the transparency gap by standardizing progress tracking across prep, shoot, and wrap phases. These documents aggregate daily logs into high-level summaries, comparing actual expenditures against estimates and ensuring multi-SKU operations remain on schedule over a typical 10-week cycle.
Structural Framework: Scheduling Prep, Shoot, and Wrap Phases
Establishing a comprehensive production report begins with defining the chronological stages of the project timeline. Preparation periods generally range from 2 to 5 weeks across various departments. For instance, the art department typically requires a 5-week lead time at approximately $3,500 per week to manage set construction, while wardrobe logistics may require a 3-week window at $800 per week. These standardized prep phases ensure that all technical and creative components are aligned before the high-cost shooting phase commences.
The core of the report tracks the active shooting schedule, which typically follows a 5-day work week over a 5-week block, totaling 25 shoot days. Reports must meticulously document 6th-day multipliers, often calculated using a 1.5x multiplier (e.g., $700/day x 1.5), and account for holiday adjustments of roughly 0.2 weeks to maintain timeline integrity. Following the shoot, the framework transitions into a 2 to 4-week wrap phase. During this time, production accountants finalize logistical close-outs, such as the 3-week production wrap and 4-week art department strike, ensuring all financial and physical assets are accounted for.
Data Metrics: Monitoring Budget Actuals and Technical Documentation
To maintain transparency for stakeholders, weekly reports must synthesize financial data by comparing budget actuals against initial estimates. Technical documentation focuses on high-impact categories such as post-production sound, which may have a budget of $132,571, and visual effects, often allocated around $100,000. By standardizing these reports into a 9-page, 8.5” x 11” US Letter format, production managers can use bold titles to highlight weekly accomplishments and specific task progress, creating a permanent record of manufacturing efficiency.
Labor validation is another critical metric, requiring the logging of specific crew rates and hour allowances to justify expenditures. For example, reports track unit shoot rates of $2,268 per day and include 14-hour day allowances—calculated as 25 days at $151.20 per day—to accurately reflect labor costs. To make this data actionable, the integration of data visuals such as charts and infographics is recommended. These tools summarize complex multi-SKU operational updates into a single PDF, allowing stakeholders to rapidly review the status of the 10-week shoot and the subsequent 25-week post-production delivery cycle.
Digital QA: Receiving Real-Time Lab Test Results
Digital QA utilizes Laboratory Information Management Systems (LIMS) to automate data entry and validation, ensuring compliance with ISO 17025 and FDA 21 CFR Part 11. By replacing manual logs with real-time analytics, manufacturers achieve a 90% faster closure of deviations and up to a 70% reduction in laboratory lead times.
The Mechanics of Digital QA: LIMS and Automated Data Integrity
The implementation of Laboratory Information Management Systems (LIMS) is the technical foundation for modern quality assurance, enabling the automated validation of samples against complex technical specifications. By digitizing the ingestion of raw data, these systems eliminate the latency and high error rates associated with manual entry. In a real-time environment, the LIMS acts as a central nervous system, flagging out-of-specification (OOS) samples immediately upon detection and ensuring that production parameters remain within strict tolerances during the entire manufacturing cycle.
Regulatory adherence is deeply integrated into digital QA frameworks through the enforcement of ISO 17025 and FDA 21 CFR Part 11 standards. These protocols ensure that laboratory accreditation is supported by robust data integrity, including comprehensive audit trails and secure electronic signatures. By automating the documentation of every test result and modification, manufacturers can provide a transparent, immutable record of compliance that is essential for both internal quality control and external regulatory inspections.

Quantifiable Efficiency: Statistical Monitoring and Lead Time Reductions
Advanced digital QA systems utilize statistical tools like Levey-Jennings Charts and Westgard Rules to maintain the accuracy of testing equipment in real-time. These methodologies allow technicians to identify random or systematic errors—such as reagent drift or instrument calibration issues—well before they impact the final product quality. By integrating these statistical rules into the LIMS workflow, labs can achieve a level of proactive monitoring that manual systems cannot match, reducing the risk of inaccurate result releases and improving overall Allowable Total Error (ATE) metrics.
The transition to a digitized quality environment produces significant operational dividends, most notably a 60-70% reduction in laboratory lead times. This increased velocity allows for faster product releases and more agile supply chain management. Furthermore, the use of real-time digital analytics facilitates a 90% faster closure of deviations and a 65% overall reduction in production-level deviations. These metrics represent a fundamental shift from reactive troubleshooting to a streamlined, data-driven approach that optimizes both laboratory performance and manufacturing throughput.
Build Your Own Premium Toilet Paper Brand with OEM Experts

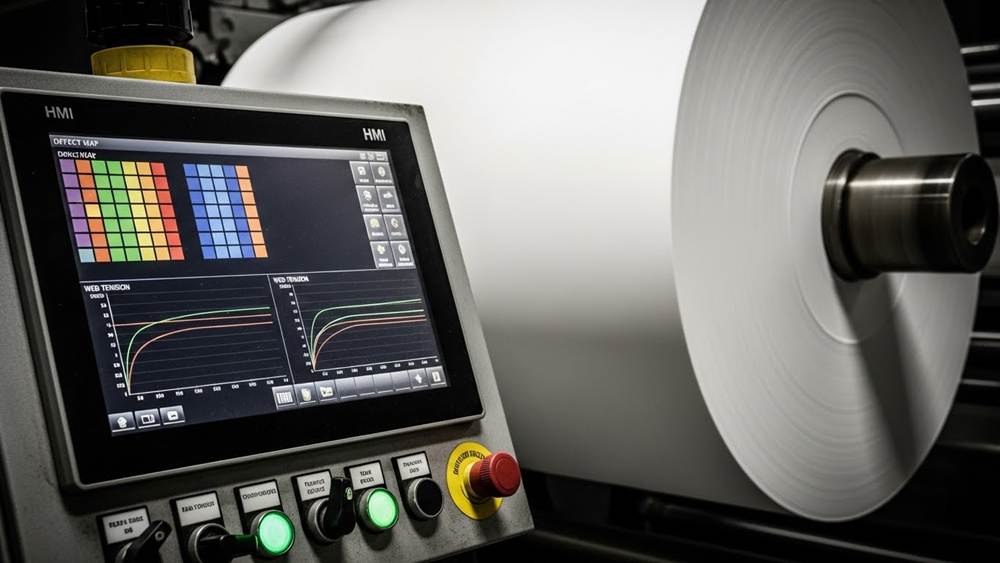
Tracking the Rewinder: Understanding Machine Logs
Machine logs for rewinder systems provide automated data on production speed, web tension, and defect maps, replacing manual oversight with verifiable digital reports. By monitoring parameters like rewind torque (up to 250+ in lbs) and slitting precision (±0.15mm), buyers can ensure roll consistency and structural integrity for high-volume paper orders.
| Performance Metric | Technical Specification | Production Impact |
|---|---|---|
| Slitting Precision | ±0.15mm (Shear) / ±0.2mm (Auto) | Ensures exact dimensional accuracy for OEM orders. |
| Maximum Rewind Speed | 1,200 ft/min (approx. 365 m/min) | Maintains 15-25 day lead times for high volumes. |
| Rewind Torque | 250+ in lbs | Guarantees consistent roll hardness and tension. |
| Paper Path Length | Up to 12.5m | Allows integration of high-res inspection cameras. |
Decoding HMI Data and Automated Production Logs
Modern paper manufacturing utilizes 10-inch touchscreen HMIs to manage real-time data handlers for tension control, web guiding, and slitting sequences, effectively eliminating manual reporting errors. These systems implement dual preset count mechanisms with increments from 0.1” to 99”, which automate deceleration and stop cycles to ensure consistent roll lengths across every batch. Furthermore, integrated PLC diagnostics play a vital role in troubleshooting high-speed transfers of up to 800 m/min, minimizing downtime and reducing the need for manual mechanical adjustments.
Critical Performance Metrics: Tension, Speed, and Defect Mapping
Monitoring high-speed operations reaching up to 1,200 ft/min allows manufacturers to meet strict production lead times of 15-25 days without sacrificing finished quality. Verification of slitting precision between ±0.15mm for shear cuts and ±0.2mm for automatic systems guarantees exact product dimensions for custom OEM requirements. By analyzing automated tension curves and rewind torque exceeding 250 in lbs, operators ensure roll hardness consistency across core sizes ranging from 25mm to 120mm. Additionally, the use of high-resolution camera integration generates PDF defect maps, providing a traceable record of product integrity throughout the entire 12.5m paper path.
Using Third-Party “Eyes” (Local QC) as Your Proxy
Third-party QC acts as an on-site proxy, using ISO 2859-1 (AQL) standards to objectively quantify defects and ensure compliance. By conducting independent audits at pre-production, during-production, and container-loading stages, buyers gain visibility into factory processes, reducing the risk of receiving substandard wood pulp products or incorrect GSM weights.
Standardizing Quality via ISO Benchmarks and AQL Frameworks
The utilization of independent inspection services centers on the adherence to ISO 2859-1 (AQL) for sampling inspections. This protocol defines specific sample sizes and acceptance or rejection criteria based on the total lot size, ensuring that quality assessments are statistically significant rather than anecdotal. By employing these standardized frameworks, third-party proxies can objectively quantify defects, providing a clear mathematical basis for accepting or rejecting a production run.
Beyond sampling, these services verify factory compliance with ISO 9001 Quality Management systems and Good Manufacturing Practices (GMP). This is particularly critical in paper and pulp manufacturing, where hygienic production environments and documentation traceability are paramount. These audits mitigate the “Black Box” effect common in global sourcing by enforcing measurable benchmarks for raw material composition and performance metrics that might otherwise be obscured by the manufacturer.
To ensure maximum transparency, defects are categorized into Critical, Major, and Minor tiers. Critical defects include safety issues or non-compliance with international regulations, while Major and Minor categories address functional failures and aesthetic deviations. This systematic classification prevents the shipment of substandard paper batches, protecting the buyer’s brand reputation and reducing the costs associated with returns and logistics failures.
Multi-Stage Inspection Protocols and Statistical Sampling
Technical execution of quality oversight begins with the selection of Inspection Levels (I, II, or III) from the AQL tables. These levels determine the statistical reliability of batch testing; Level II is generally the standard for consumer goods, while Level III offers higher scrutiny for high-stakes components. For modern facilities, this may be supplemented by During-Production (DUPRO) monitoring, which utilizes IoT sensors and AI-driven analytics to provide real-time alerts regarding process deviations and mechanical drift.
Pre-shipment inspections focus on the technical physical properties of the paper products. Inspectors conduct on-site testing for GSM (grams per square meter), ply count, and paper absorbency to ensure the product meets the agreed-upon technical specifications. These rigorous checks confirm that the manufacturer has not substituted lower-grade pulp or reduced material density to save costs, which are common risks in high-volume paper procurement.
The final stage involves Container Loading Checks (CLC), where the proxy ensures that palletization and loading meet international shipping standards. This step verifies that the correct quantity of goods is loaded and that the packaging integrity is sufficient to prevent moisture ingress or structural damage during maritime transit. By maintaining a presence at the loading dock, third-party inspectors provide a final layer of accountability before the goods enter the global supply chain.
Packaging and Palletization Live Stream Audits
Live stream audits replace manual pallet checks with automated, sensor-driven verification of load stability, film tension, and Ti-Hi configurations. By integrating systems like MANTIS or PalletSCAN with WMS, manufacturers provide real-time proof that cargo meets ISO 11607 and CQI-8 standards, eliminating ‘black box’ transit damage risks.
Real-Time Structural Integrity and Wrapping Validation
The integration of the MANTIS (Ercopac) system enables robotic inspection of empty pallets to identify structural vulnerabilities before they enter the loading phase. This automated process detects damaged plinths, dangling axles, and other critical defects, facilitating the immediate routing of non-conforming pallets to prevent downstream shipping failures.
In-line wrapping test stations serve as a primary audit point by monitoring essential stability metrics during the packaging cycle. These systems measure stretch film tension, layer-to-layer adhesion, and the load’s overall resistance to movement, ensuring that every unit complies with pre-set stability parameters before it leaves the facility.
To simulate the rigors of transit, advanced sensor-based systems replicate transport stressors such as jolts, tilts, and vibrations. This validation step confirms that the palletized load maintains its shape and structural integrity under pressure, providing a data-driven assurance of load distribution and stability.
Automated logic within the audit engine ensures that any deviation from stored dimensions or shape limits triggers an immediate intervention. By utilizing real-time sensor data, manufacturers can automatically divert pallets that fail to meet specific stability benchmarks, maintaining a high standard for all outbound cargo.
Technical Compliance: Ti-Hi Metrics and ISO Standards
The implementation of PalletSCAN 150 technology automates the Ti-Hi counting process, accurately measuring cases per layer and total pallet height. This data is compared in real-time against the Advanced Shipping Notice (ASN) within the WMS, ensuring that the physical cargo perfectly matches the digital record before final dispatch.
Adherence to ISO 11607 performance testing standards is a cornerstone of the live audit process, specifically defining “worst-case” scenarios for palletized loads. These audits verify that packaging can withstand sliding, slamming, and forklift collisions, protecting the product from common handling and storage hazards throughout the supply chain.
By integrating Layered Process Audits (LPA) following CQI-8 guidelines, manufacturers can satisfy rigorous OEM-specific packaging requirements. This systematic approach ensures that every layer of the packaging process is audited against technical benchmarks, improving overall quality and reducing the risk of transit-related claims.
To support global trade transparency, all high-resolution camera images and sensor data from the live audit are archived within a Cloud-based Warehouse Management System. This creates a permanent, searchable audit trail that provides international buyers with verifiable evidence of compliance and shipment condition.
Cloud-Based Project Management for OEM Orders
Cloud-based OEM project management centralizes production visibility by normalizing disparate machine data into uniform cloud payloads, reducing data transactions by 45%. By integrating configure-to-order ERPs like SAP S/4HANA or Microsoft Dynamics 365, manufacturers can process complex MRP runs in under 22 seconds while providing buyers with real-time milestone billing and inventory transparency.
| Optimization Category | Technology/Platform | Technical Impact |
|---|---|---|
| Data Normalization | HighByte Intelligence Hub | 45% reduction in cloud data transactions via time-series buffering. |
| MRP Processing | SAP S/4HANA | Completion of complex MRP runs in under 22 seconds for multi-SKU operations. |
| Order Management | Esker OMS / Oracle EBS | AI-driven EDI exception handling and live web services for inventory. |
Unified Data Normalization and Real-Time Production Monitoring
The foundation of modern OEM project management lies in the utilization of the HighByte Intelligence Hub to achieve a 45% reduction in cloud data transactions. This is accomplished through sophisticated time-series buffering and Parquet file curation, which allows for the normalization of heterogeneous data from disparate OEM sources—ranging from legacy equipment to modern control systems—into uniform payloads for platforms like Azure IoT Hub.
By implementing templatized project models, manufacturers can ensure rapid deployment across diverse machine portfolios, effectively creating a single source of truth for project status. Furthermore, cloud-based buffering and curation strategies minimize egress fees while maintaining granular production logs, providing buyers with the level of inventory transparency and milestone tracking required for complex industrial orders.
Configure-to-Order ERP Integration and Fulfillment Transparency
High-speed processing is a critical component of OEM fulfillment, with SAP S/4HANA capable of completing MRP runs in under 22 seconds, even for large-scale multi-SKU operations. This level of performance supports complex configure-to-order Bill of Materials (BOMs), which often include intricate sub-assemblies, phantoms, and specialized milestone or progress billing requirements within systems like Acumatica and Rootstock.
To further streamline the fulfillment cycle, AI-driven order management via Esker OMS centralizes multichannel orders and automates EDI exception handling, reducing manual intervention. Native ERP connectors for Oracle EBS and Microsoft Dynamics 365 F&O provide live web services, enabling real-time price and inventory availability checks that ensure buyers and operations managers remain synchronized throughout the production workflow.
Final Thoughts
The era of blind trust in overseas manufacturing has officially been replaced by a data-driven technical ecosystem where transparency is the baseline, not a luxury. By integrating IoT-enabled sensors, Laboratory Information Management Systems (LIMS), and real-time machine logs, the “black box” of China-based production is finally wide open. Whether you are monitoring rewinder torque for paper consistency or utilizing automated vision systems for defect detection, these remote tools provide a level of granular oversight that often exceeds what can be captured by physical on-site visits alone.
Adopting these transparency protocols—from ISO-standardized AQL inspections to SAP-integrated cloud project management—is no longer just about preventing errors; it is about building a resilient, agile supply chain. By reducing laboratory lead times by 70% and achieving 90% faster closure of production deviations, buyers can protect their brand integrity and ensure regulatory compliance from thousands of miles away. In the modern manufacturing landscape, the most successful partnerships are those built on immutable digital audit trails and the real-time validation of every SKU produced.
Frequently Asked Questions
How can I monitor production progress remotely from overseas?
You can utilize Industrial IoT (IIoT) sensors and cloud-based dashboards to track machine performance, downtime, and production counts in real-time. These systems often feature a quick 15-minute setup, allowing you to monitor Chinese factory operations from any location without physical travel.
Is live video streaming available for the packaging and loading process?
Yes, factories can implement industrial sensing cameras, such as the Sick sensingCam 100, which provide event-triggered live streaming. These IP65-rated systems can monitor high-speed lines processing up to 240 packages per minute, ensuring real-time visibility into jams, labeling, and palletization.
What specific metrics should be included in weekly production reports?
Weekly reports should detail finished goods counts, Work-in-Process (WIP) levels, and machine efficiency via Overall Equipment Effectiveness (OEE). They should also include quality control metrics, such as inspection pass/fail rates, summarized by shift and department.
How can I verify that the machine output reported by the factory is actually accurate?
Machine output accuracy is verified through a three-phase equipment qualification process: Installation (IQ), Operational (OQ), and Performance (PQ). This is supplemented by redundant sensors, regular calibration using test weights, and formal inspection and analysis protocols.
Can I use WhatsApp or WeChat for real-time quality control (QC) updates?
While mobile apps allow for immediate alerts to stop flawed production, they must be used within a compliance framework. This includes utilizing end-to-end encryption, multi-factor authentication, and automated message capture systems to ensure an immutable audit trail for all QC communications.
What digital tools help manage complex OEM orders from overseas?
Overseas orders are managed efficiently using Order Management Systems (OMS) and ERP-integrated platforms that support EDI standards (X.12, UN/EDIFACT). Utilizing these digital tools can result in a 40% reduction in processing time through real-time inventory and shipping automation.