Fluctuating pulp prices often catch B2B buyers off guard, yet the mechanics of the global commodity market dictate every invoice. Because raw material specs like fiber length and Kappa numbers govern 60% to 80% of the energy-intensive conversion process, understanding the pulp market influence becomes essential for maintaining profit margins.
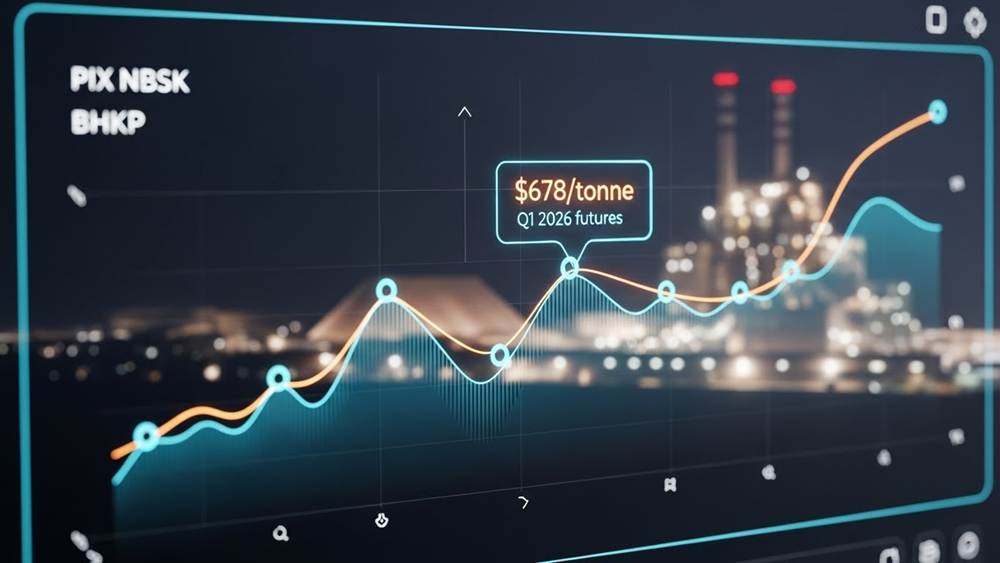
We explore how global indices like Fastmarkets FOEX track weekly shifts and why retail tissue prices often take over a year to reflect these changes. By analyzing Q1 2026 futures—currently trading at $678 per tonne for NBSK—procurement teams can use layered contracts to stabilize costs against port strikes, droughts, and energy price spikes.
The Relationship Between Raw Pulp and Finished Goods
Raw pulp properties like fiber length, Kappa numbers, and hemicellulose content serve as the primary blueprint for paper quality. Softwood pulp with high hemicellulose levels enhances fiber bonding, resulting in a tensile index of 75–85 Nm/g. These raw specifications govern 60-80% of the energy-intensive conversion process and determine whether the final product meets international standards.
| Pulp Property | Technical Specification | Impact on Final Product |
|---|---|---|
| Fiber Length | Long (NSWBK) vs. Short (Hardwood) | Determines structural integrity and tear resistance. |
| Fines Content | 5% to 15% (Kraft Pulp) | Balances machine drainage with sheet opacity. |
| Hemicellulose | High levels in softwood | Increases tensile index to 75–85 Nm/g. |
| Kappa Number | Below 16 (Target <3 for specialty) | Defines bleachability and chemical consumption. |
| Pulp Yield | 42% to 54% (Chemical) | Influences energy ratios and fiber strength. |
Physical Fiber Characteristics and Product Durability
Fiber length serves as the primary parameter defining the category and end-use of the pulp. Northern Softwood Bleached Kraft (NSWBK) utilizes long fibers to establish a robust structural framework, making it suitable for high-ply products that require durability. In contrast, short fibers from hardwood pulps provide smoothness but less mechanical strength. The refining process focuses on these fibers to develop specific sheet properties.
Hemicellulose content plays a vital role in how fibers bond during production. Softwood pulps with higher hemicellulose levels facilitate better fiber-to-fiber bonding. This chemical composition directly pushes the tensile index into the 75–85 Nm/g range. Non-wood alternatives like rice straw offer different mechanical profiles, often reaching tear indices of 4.5–6 mN·m²/g, which shows how raw material selection dictates the final performance of the sheet.
Managing fines content remains a priority for maintaining manufacturing efficiency. We keep kraft pulp fines between 5% and 15% to ensure the paper machine drains water effectively. This range also preserves the opacity of the sheet. If fines exceed 40%, as seen in groundwood mechanical pulp, drainage slows significantly and bonding weakens, though yield stays high because the lignin remains intact.
Chemical Metrics and Manufacturing Efficiency Benchmarks
Kappa numbers provide a measurable standard for delignification during the pulping process. Manufacturers target a Kappa number below 16 to produce high-brightness virgin pulp without using excessive bleaching chemicals. Rice straw treated with 12% alkali at 150°C achieves a Kappa number of 10.3, while higher alkali concentrations can lower this further. Lowering the Kappa number simplifies the transition to finished goods but often results in lower fiber yields.
Chemical pulping yields typically fall between 42% and 54% because the process prioritizes fiber strength over mass. This trade-off is significant since the conversion process accounts for 60% to 80% of the total energy consumed in the facility. While mechanical processes offer yields above 90%, they produce weaker, darker paper because the retained lignin prevents tight fiber bonding. Specialized products, such as corn stalk handsheets, demonstrate a burst index of 0.99 kPa·m²/g, highlighting how specific non-wood specs suit eco-friendly packaging needs.
Quality control relies on standardized testing to ensure compliance with global safety requirements for 2026. Technicians use TAPPI standards like T212 to measure alkali solubility, which quantifies fiber degradation. Other metrics, such as T231 for zero span breaking strength, provide data on the intrinsic strength of the fibers before they enter the paper machine. These benchmarks allow mills to adjust refining energy and chemical additives to match the raw pulp’s specific profile.
Tracking NBSK and BHKP Global Price Indices
Global pulp pricing relies on the PIX NBSK and BHKP indices from Fastmarkets FOEX and TTO. These benchmarks track weekly gross and monthly net prices across major hubs. Because standard reports lag by 30 to 60 days, procurement teams use NOREXECO futures, such as the Q1 2026 NBSK projection of $678 per tonne, to anticipate shifts.
| Index / Asset | Type & Frequency | Benchmark Value |
|---|---|---|
| Fastmarkets FOEX PIX NBSK | Weekly Gross (USD) | European Reference Point |
| TTO (Trade Tree Online) | Monthly Net (Global) | Base 2016 = 100 |
| NOREXECO NBSK (Shanghai) | Q1 2026 Futures | $678 per tonne |
| NOREXECO BHKP (China Net) | Q1 2026 Futures | $550 per tonne |
Core Indices for Softwood and Hardwood Pulp
Fastmarkets FOEX PIX NBSK and BHKP indices serve as the primary benchmarks for the paper industry. These tools aggregate weekly gross prices in US dollars per tonne by collecting data from buyers and sellers. These indices represent over 50% of European market pulp volumes, providing a stable reference for contract negotiations. Manufacturers use these figures to establish a baseline for long-term agreements without the noise of individual discounts.
TTO (Trade Tree Online) offers a different perspective by focusing on monthly transaction-based net-price indices. Unlike gross price benchmarks, TTO covers global markets including China and North America. It uses a May 2016 baseline of 100 to help manufacturers track long-term price volatility for both Northern Bleached Softwood Kraft (NBSK) and Bleached Hardwood Kraft (BHK) fibers. This system allows procurement teams to see actual market costs after various discounts and rebates are applied.
Managing Index Lag and 2026 Price Forecasts
Traditional pulp indices, including those from PPPC and Fastmarkets, experience a publication lag of 30 to 60 days. This delay means reported data often reflects past physical transactions rather than current market conditions. To counter this, buyers use weekly monitoring dashboards with a 5% threshold to validate supplier price adjustments against these shifting benchmarks. This verification ensures that price hikes align with broader market trends.
Futures markets on the NOREXECO exchange provide a forward-looking view of costs. For the first quarter of 2026, Shanghai NBSK futures trade at approximately $678 per tonne. During the same period, BHKP China Net futures indicate a stabilized benchmark of $550 per tonne. These forward-looking figures allow manufacturers to hedge risk and plan budgets well before physical delivery. By tracking these numbers, companies can adjust their procurement strategy based on anticipated supply and demand shifts in the global market.
Why Tissue Prices Don’t Drop as Fast as Pulp Prices
Retail tissue prices lag behind pulp market shifts due to long-term contracts and high fixed costs. While jumbo reels adjust within two quarters, finished goods often take a full year to reflect pulp price drops because non-pulp expenses like energy and chemicals remain static.
Contractual Frictions and Supply Chain Time Lags
Finished tissue products show a 4-5 quarter delay in price adjustments, whereas jumbo reels typically respond within 1-2 quarters. Fixed tissue agreements often last between 4 and 6 months, but pulp contracts adjust on a monthly basis. This temporal gap creates a buffer that prevents retail prices from shifting immediately when raw material costs fall.
Retailers resist price hikes above 8% because consumer data indicates that increases exceeding 10% cause sharp declines in purchase volume. Global manufacturers like Top Source Hygiene manage these lags by stabilizing production costs across multi-month delivery cycles. This approach ensures price consistency for international clients despite the volatility of the upstream pulp market.
Impact of Non-Pulp Costs and Integration Gaps
Pulp represents 50-70% of total production costs, but fixed expenses do not fluctuate with fiber prices. Energy costs average $100 per metric ton and chemicals cost roughly $60 per metric ton regardless of pulp market trends. Non-integrated producers, who operate 85% of global capacity, face 20% higher operational costs than vertically integrated mills. These fixed overhead expenses maintain a high price floor for finished paper goods even when raw fiber becomes cheaper.
Manufacturers frequently offset fiber costs by adjusting the material mix. Replacing 6% long fiber with short fiber saves approximately $1 million per 70,000 tons of production. By optimizing the ratio of long and short fibers, producers maintain margins without needing to adjust retail prices. Fixed overhead expenses currently average $150 per metric ton, further insulating the final product price from raw material cycles.
Scale Your Brand with 30 Years of Expert OEM Manufacturing

Impact of Global Energy Costs on Paper Converting
Energy represents the third-largest operating cost in paper manufacturing. High natural gas and electricity prices inflate the cost of thermal processes like pulp drying, which requires $1.5 billion in annual spending. In 2026, these energy pressures determine production stability and the final consumer pricing for tissue and towel goods.
Thermal Energy Intensity in Pulping and Drying
Drying paper requires intense thermal input, costing the forestry and pulp sector approximately $1.5 billion every year. Most wood pulp processing facilities generate steam using natural gas, making the supply chain sensitive to price fluctuations in the global energy market. Total sector energy use reached 1,361 petajoules in recent cycles, illustrating the heavy resource demands required to maintain a consistent flow of paper goods.
Production Capacity and Renewable Power Integration
Energy price spikes have forced mills to suspend machine operations to protect profit margins, which recently triggered a 5.9% decline in total production capacity across major markets. To counter these costs, modern facilities now generate over 60% of their power through renewable Combined Heat and Power (CHP) systems. Facilities focused on recycled paper face greater economic pressure than virgin pulp operations because they cannot substitute purchased natural gas as easily during supply shortages.

Hedging Strategies for Large Volume Importers
Large volume importers manage pulp price volatility and exchange rate shifts using layered forward contracts. By staggering coverage from 80% for near-term needs to 20% for future quarters, companies smooth average costs. This strategy protects against sudden spikes in USD/CAD or other currency pairs while maintaining flexibility to use spot markets during 2026.
Layered Forward Contracts for Currency Stability
Importers layer forward contracts at 80% for the first three months, 60% for months four through six, and 40% for months seven through nine to establish a stable average exchange rate. This staggered approach ensures that the bulk of near-term costs are locked in while allowing for adjustments in later periods. A 20% coverage floor for the final quarter provides baseline protection for long-term 2026 procurement goals. These graduated notional allocations smooth USD/CAD oscillations within the 1.3100 to 1.3800 range, shielding profit margins from aggressive currency swings.
Rolling Hedge Models and Allocation Ratios
Rolling hedges utilize six sequential monthly contracts, where procurement teams book new contracts six months in advance as each current month matures. Many organizations adopt hybrid strategies that commit 50% of the notional value upfront, add 25% during the first fulfillment phase, and reserve the final 25% for the spot market. This structure allows buyers to capture favorable price dips without being fully exposed to market volatility. When paired with stop-loss orders on forward contracts, this model enables dynamic execution if commodity costs decline unexpectedly, balancing price certainty with market opportunity.
Analyzing Supply Disruptions: Port Strikes & Droughts
Supply chain instability in 2026 stems from a mix of logistical bottlenecks and environmental pressures. Shipping reroutes and port labor disputes delay fiber deliveries, while mill closures reduce overall capacity. Ten producers control 55% of supply, meaning even small disruptions in regions like the US South significantly impact global pricing.
Geopolitical and Logistical Shocks to Fiber Logistics
Global logistics routes face significant strain as ships divert away from major corridors like the Red Sea. Reroutes extend lead times and push freight costs higher for virgin wood pulp deliveries. Top producers consolidated the market, with ten companies now controlling 55% of global supply. This concentration makes the industry vulnerable to localized events like port strikes, which ripple through the entire chain quickly. China’s consumption patterns dominate the sector. The region drove over 90% of global market pulp demand growth in recent decades. Heavy reliance on Asian ports means congestion there creates immediate shortages elsewhere.
Environmental Volatility and Infrastructure Capacity Loss
The US pulp industry lost 7% of its total capacity since 2019 after ten major mill closures and three idlings. These closures reduced the market’s ability to handle sudden supply shocks. Production remains geographically concentrated. The US South provides over 85% of global fluff pulp supply, leaving manufacturers exposed to severe weather and drought-related wood fiber shortages. Large-scale facility shutdowns add to the pressure. The 1.5 million ton gap from the Metsä Kemi bioproduct mill shutdown keeps supply balances tight for Northern Bleached Softwood Kraft (NBSK) and hardwood pulp through 2026.
Understanding “Recycled” Pricing vs. Virgin Pulp
Recycled paper typically offers 10-30% savings for standard commercial grades because it requires 40-70% less energy and fewer raw materials than virgin pulp. Food-grade recycled products often cost 5-20% more than virgin alternatives because the intensive decontamination and safety testing required to meet international hygiene standards increase production overhead.
Raw Material Inputs and Resource Efficiency Gains
Producers yield one tonne of recycled pulp from approximately 1.2 tonnes of waste paper. In comparison, virgin pulp production requires 2.5 tonnes of wood for the same output. This discrepancy in raw material volume directly influences the price gap. Recycled paper manufacturing consumes 40% to 70% less energy and 35% less water than the energy-intensive Kraft process used for virgin wood fibers.
These resource efficiencies allow non-food grade recycled products to maintain a 10% to 30% price advantage over virgin wood pulp items in 2026. Beyond the direct financial impact, using recycled content saves 17 trees per ton and reduces landfill waste by 3.3 cubic yards for every ton of finished product. This resource leverage makes recycled fiber a more cost-effective choice for bulk industrial and commercial applications.
Grade-Specific Pricing and Market Volatility Factors
Food-grade recycled paper commands a 5% to 20% price premium. Decontaminating inks, adhesives, and mineral oils requires specialized equipment to ensure the material meets FDA and EU safety standards. These extra processing steps negate the initial savings found in cheaper raw material inputs. While standard recycled grades benefit from low-cost waste paper, high-hygiene applications involve more complex purification cycles.
Old Corrugated Container (OCC) prices fluctuate significantly, ranging from $27 to $180 per ton of pulp. This creates higher price volatility for recycled products compared to the more stable virgin wood fiber markets. Fiber degradation also plays a role in cost parity. Because fibers shorten during the recycling process, manufacturers often use chemical additives to ensure strength. As 2026 began, secondary paper and cardboard prices in the EU averaged approximately 156€ per tonne, acting as a baseline for global recycled export pricing.
Final Thoughts
Technical benchmarks like fiber length and Kappa numbers dictate 60% to 80% of conversion costs. These specifications determine if a product meets international standards and how it performs during manufacturing. Businesses that align their procurement with these physical metrics gain a better understanding of why market prices fluctuate.
Importers who track NOREXECO futures and utilize layered forward contracts manage volatility more effectively. Staying ahead of energy price shifts and logistical bottlenecks helps companies stabilize their budgets throughout 2026. These strategies ensure a steady supply of tissue and paper goods even when global commodity markets shift unexpectedly.
Frequently Asked Questions
Why do toilet paper prices change so frequently?
Volatility in the pulp market drives these fluctuations. Raw material costs for wood chips and recycled fiber shift due to supply chain disruptions and energy expenses. Manufacturers often use a 70% hardwood and 30% softwood pulp blend to balance softness and strength, making the final product sensitive to global commodity pricing.
How can I track raw wood pulp prices in the Chinese market?
Monitor benchmark indices like the Fastmarkets FOEX PIX China Pulp index, which publishes weekly USD rates for CIF China delivery. For domestic spot trends in RMB, use the SCI China Imported Wood Pulp Price Index or SunSirs China Wood Pulp Daily Prices to track grade spreads between softwood, hardwood, and chemi-mechanical pulp.
Does bamboo pulp pricing follow wood pulp trends?
No. Bamboo pulp typically costs less to produce and sells at lower market rates. Bamboo kraft pulp remains between $800 and $1,100 per ton. Its production costs sit roughly 30% to 70% below wood pulp equivalents, as bamboo raw materials are more localized and cost-efficient to harvest.
How does the European energy crisis impact paper costs in China?
High energy prices in Europe inflate global pulp and paper benchmarks. Although China maintains different energy tariffs, it imports pulp based on these international indices. This transmission has historically caused Chinese paper list prices to climb 20% to 35% when European graphic paper prices spike.
When is the ideal time to secure lower paper prices?
July is the traditional off-season for the packaging and paper industry. During this period, weak downstream demand often leads large mills to implement price reductions of 30 to 150 yuan per ton. Locking in contracts during this window avoids the typical price hikes that begin in August.
What strategies mitigate the risk of sudden pulp price spikes?
Procurement teams use financial hedging tools like futures contracts and over-the-counter (OTC) derivatives to stabilize costs. Monitoring market-reflective indices for NBSK and BEK pulp spot prices allows businesses to time their volume purchases more effectively throughout the 2026 fiscal year.